
This post will review various options on how to leverage the settings and styles in Civil 3D to display cut and fill in:
• Volume Surfaces
• Profile Views
• Corridors
• Section Views.
Profile Views:
From the Profile View Properties > Hatch tab, patterns can be applied between Profile lines. This feature utilizes the configuration in Quantity Takeoff Criteria, typically used for Section Volume calculations shown later in this post. 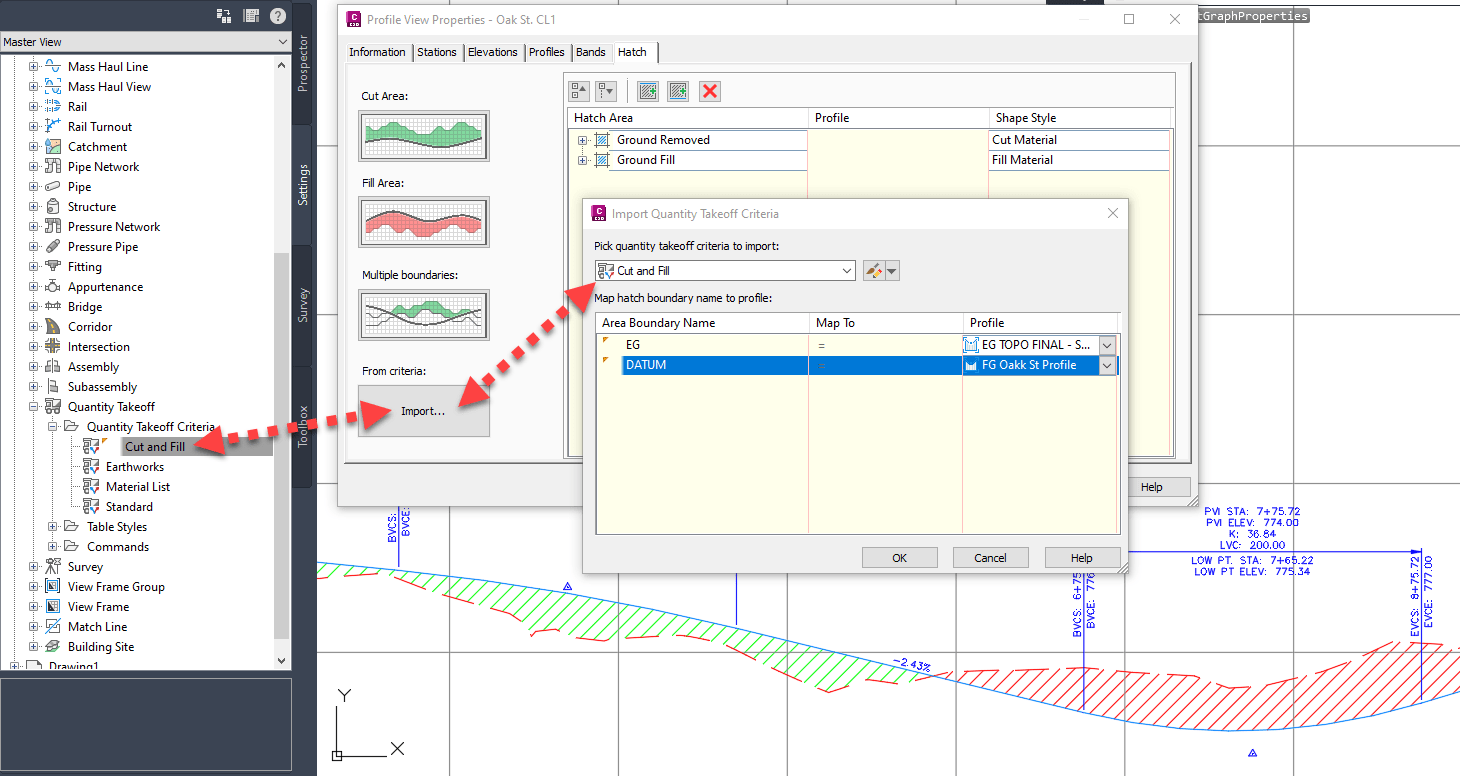
Profile View hatches will not show any numerical values for amounts of cut or fill. To output some data turn to the Profile View Properties > Band tab. Using a previously configured Profile Data band type and assigning Profiles:
• on the left side, shown in RED are EG elevations (Profile 1).
• to the right side, shown BLUE are the FG elevations (Profile 2).
• at the top (in parentheses), in MAGENTA is the difference. 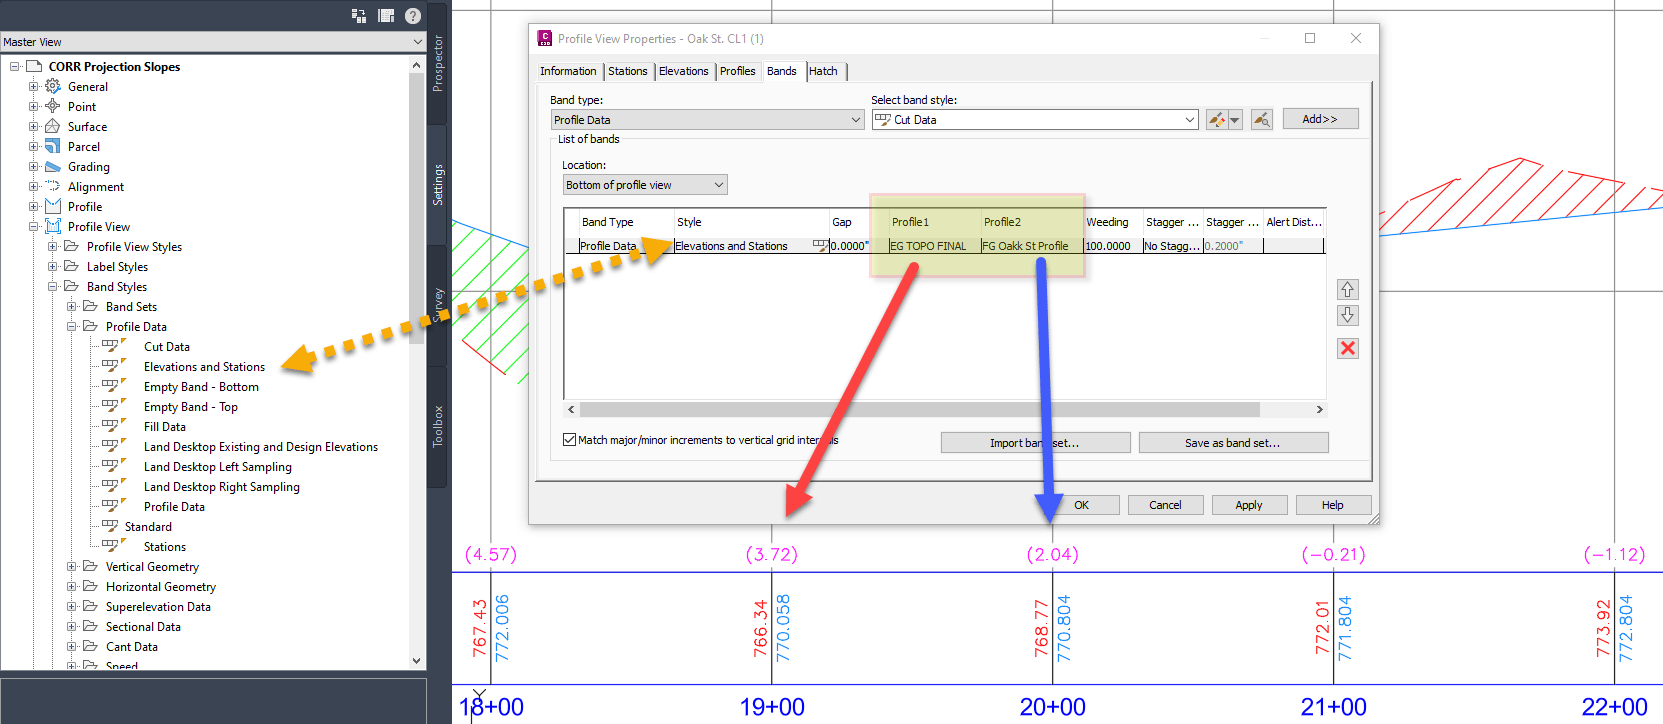
Corridor – Code Sets:
Subassembly Points are connected in the Corridor by Feature Lines, that linework can be stylized as needed. Shown in Plan View, a linetype pattern with text (C or F) is used along with a color for cut and fill. 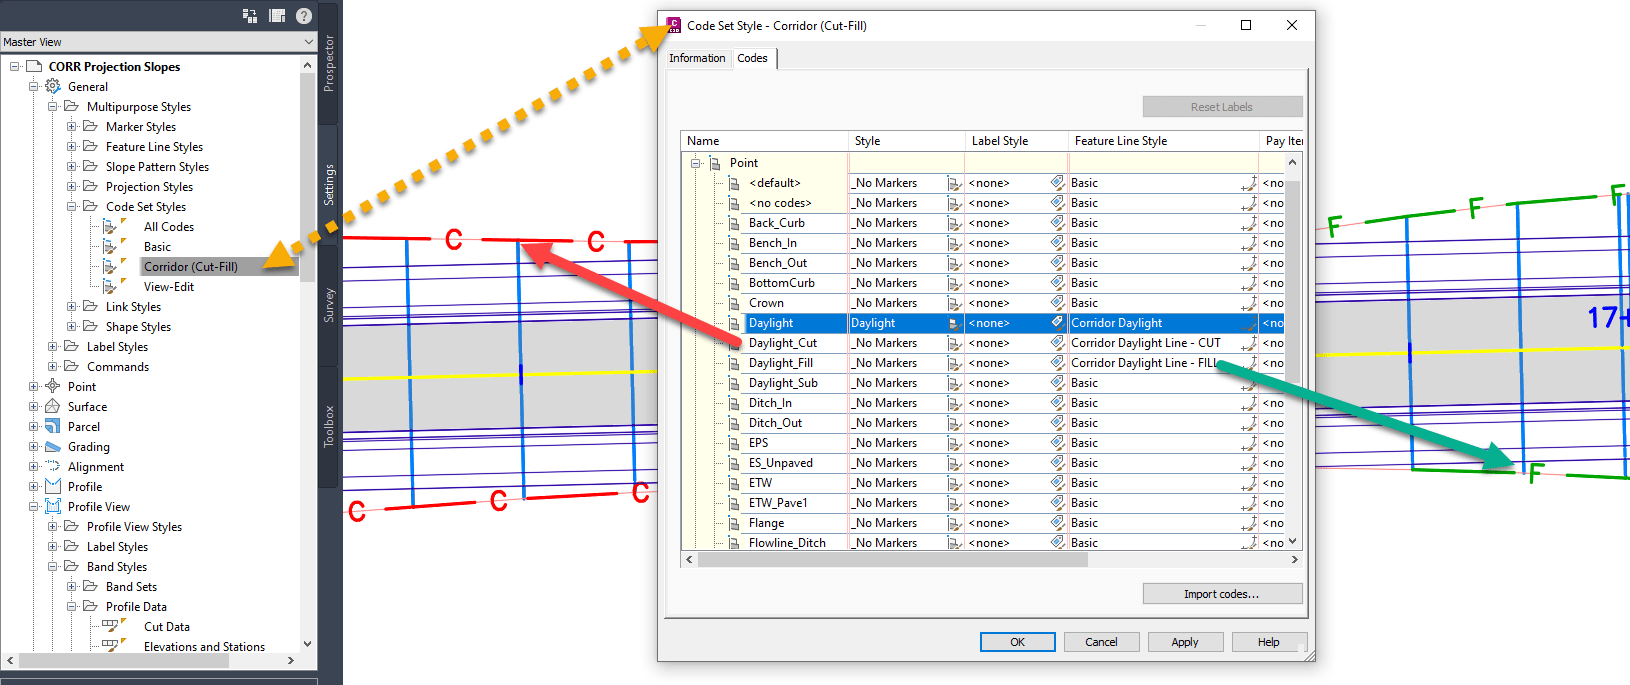
Additionally, areas in between Subassembly Links can be highlighted by applying a Material Area Fill Style. Highlighting in Plan View where the cut and fill is happening. 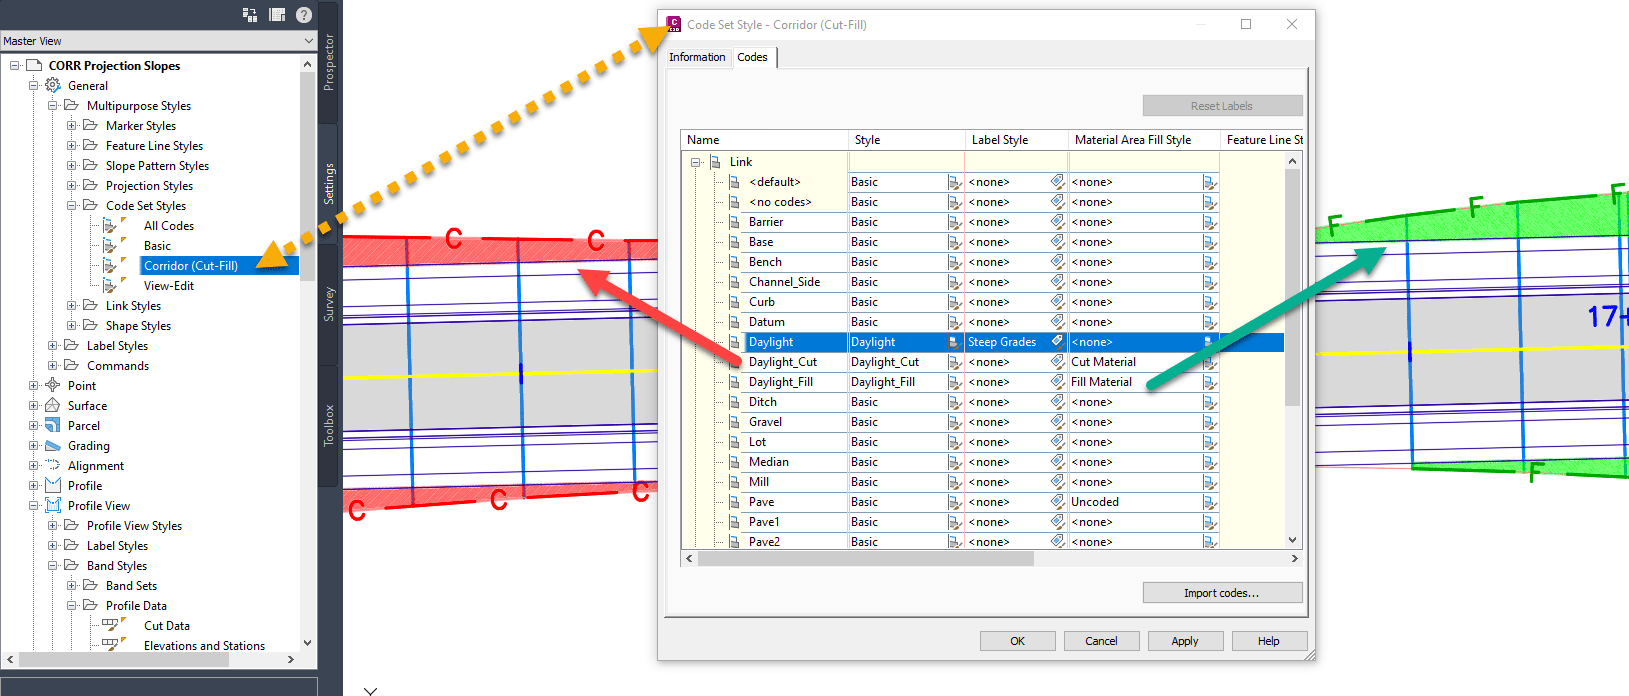
Corridor – Slope Patterns:
Another method to emphasize Cut and Fill, requires a more manual approach. Using the Add slope pattern button, from the Corridor Properties > Slope Patterns tab. You will select the feature lines where the styles are to be added to. First, select the ETW is and the corresponding Daylight feature one side. Then, do the same on the opposite side. Next, corresponding cut and fill Slope Pattern Style is applied. This will have to be repeated for each side and area. 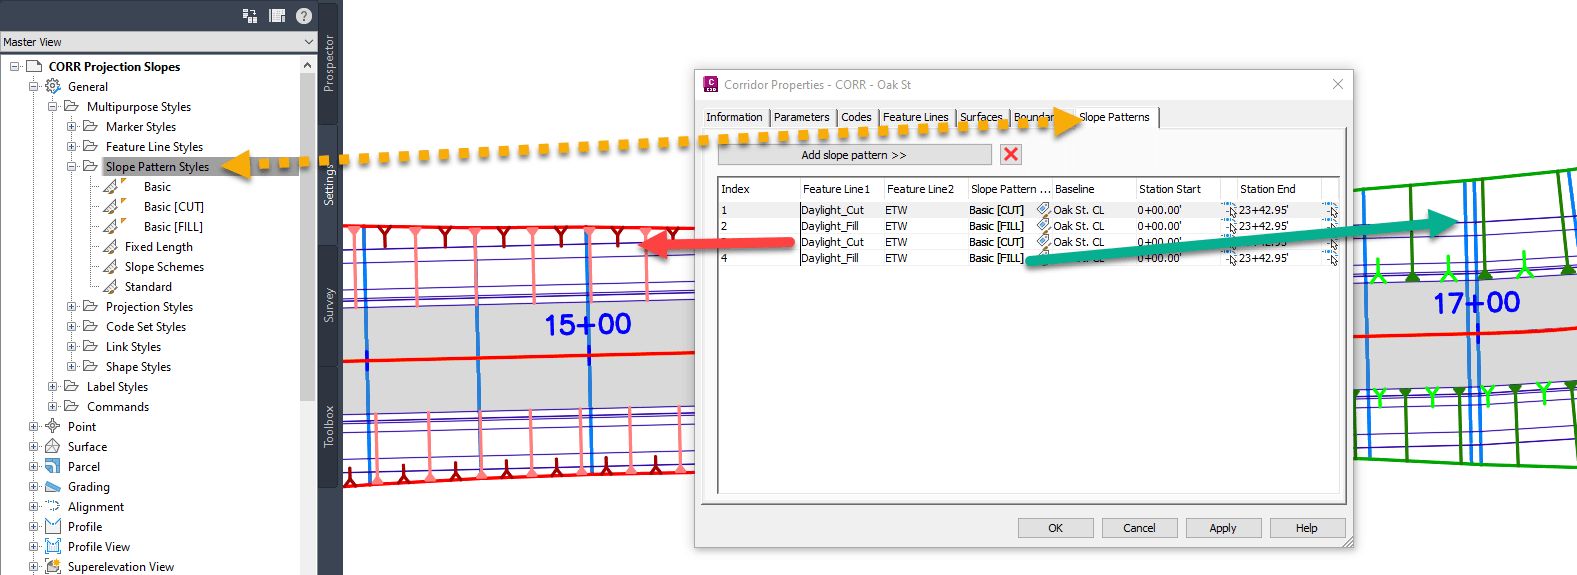
Volume Surfaces:
When two surfaces are present in a drawing they can be compared. Frist, the Existing Ground and Proposed Datum surfaces are used to create a Volume Surface. Next, ensure Volumes areas can be seen by using a Surface style that shows the Elevations component from the Surface style > Display tab. From the same Surface style > Analysis tab, default ranges and color scheme can be set under the Elevations section. 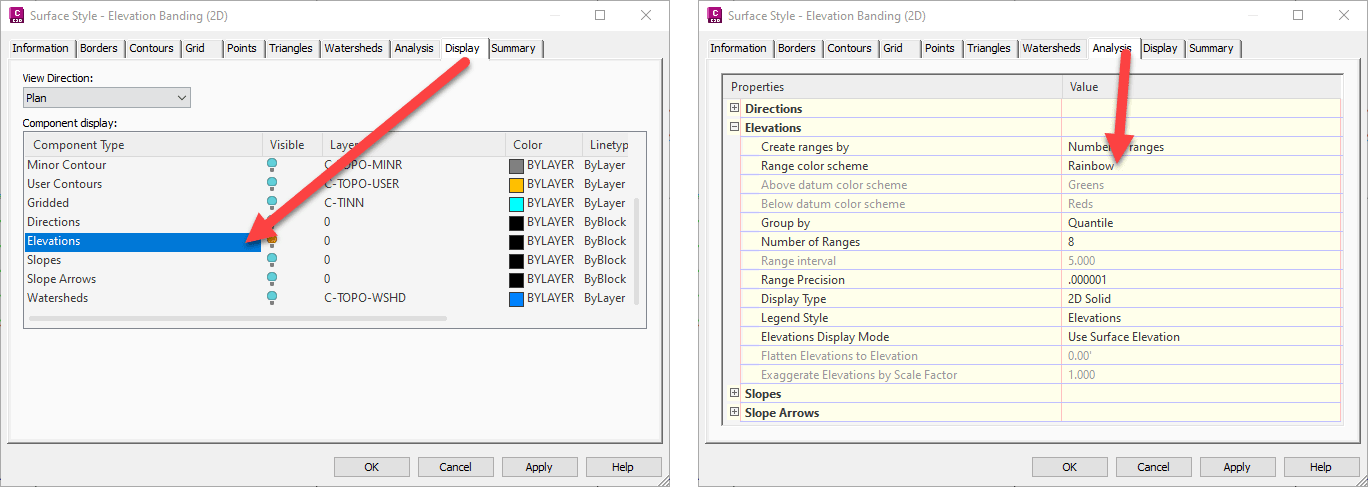
Then, highlighting cut and fill areas can be done from the Surface Properties > Analysis tab. Here users can edit the total number of Ranges and apply colors to defined Minium and Maximum elevations. 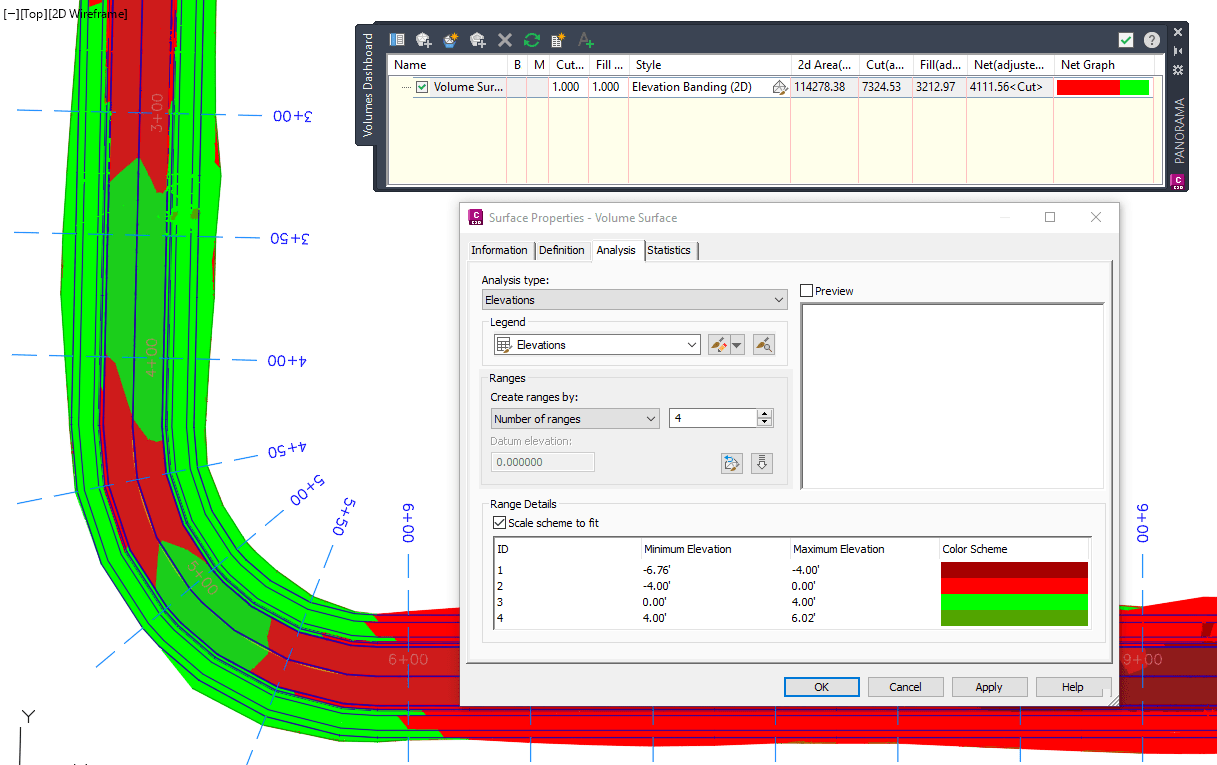
Section Views – Compute Materials (QTO):
Showing cut and fill by comparing Existing and Proposed surfaces can be accomplished with Section Views, by leveraging a configured Quantity Takeoff Criteria. From the ribbons Analyze tab > Volumes and Materials panel > Compute Materials command. Once materials have been computed they will be automatically highlight in section views, using the selected Shape Style materials. 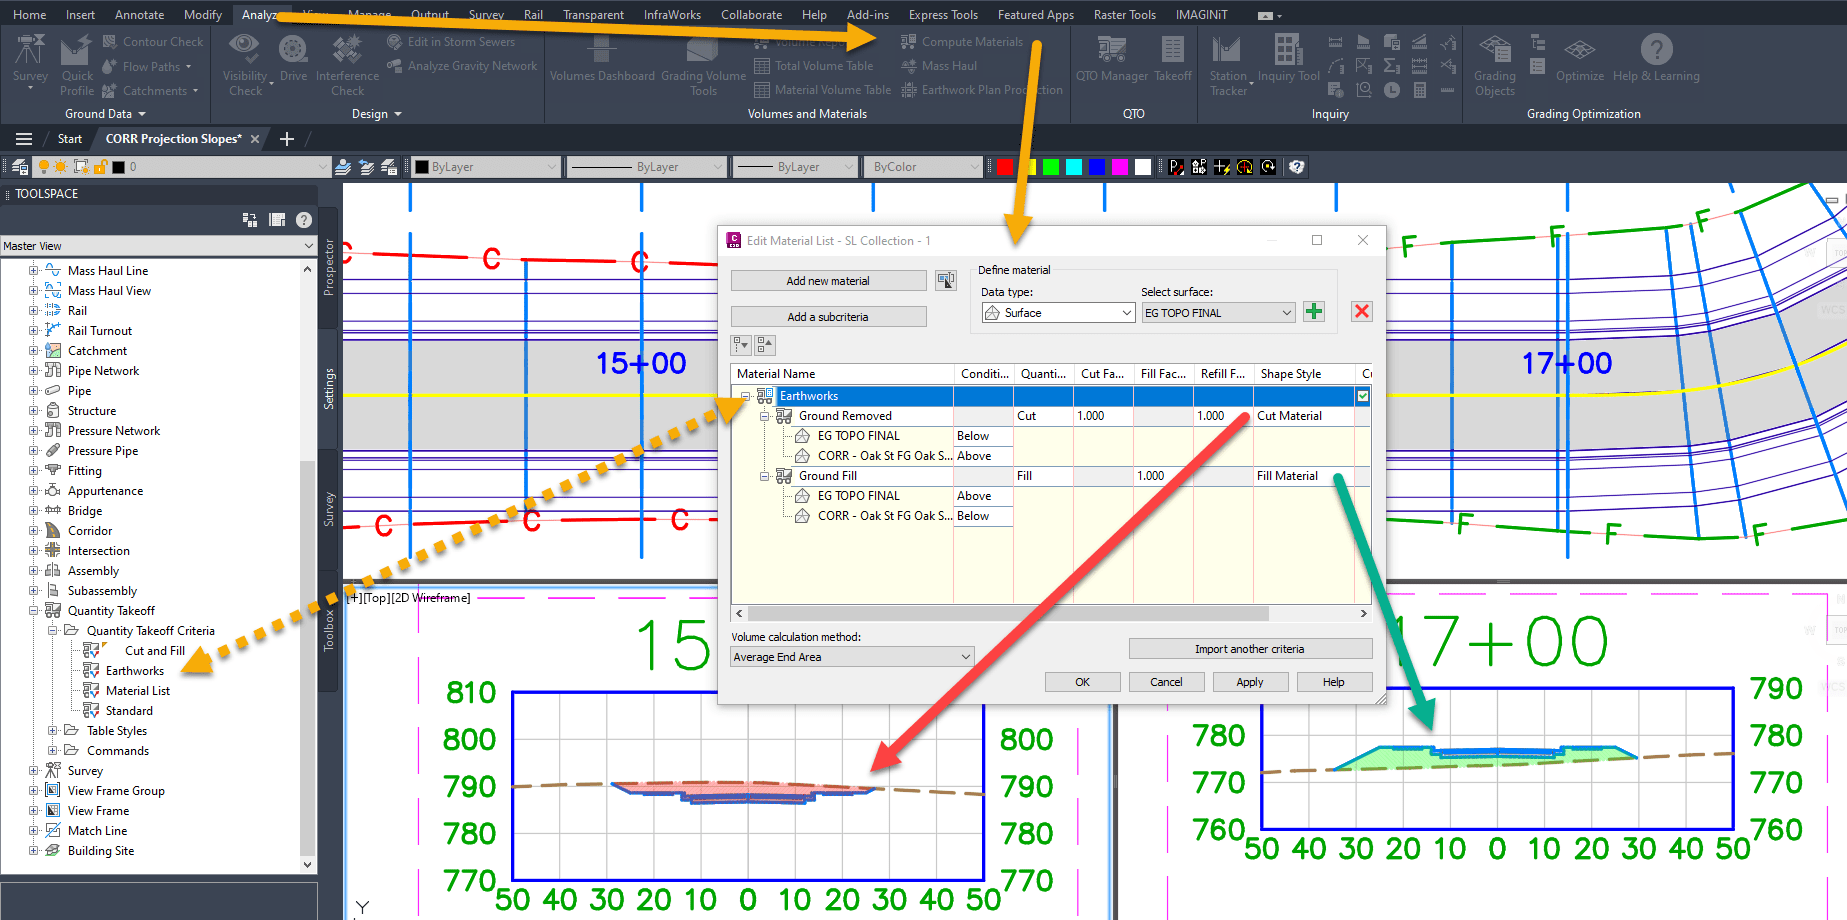
Additionally, the computed material volumes can be shown in a tabular format by using the Total Volume or Material Volume tables commands. 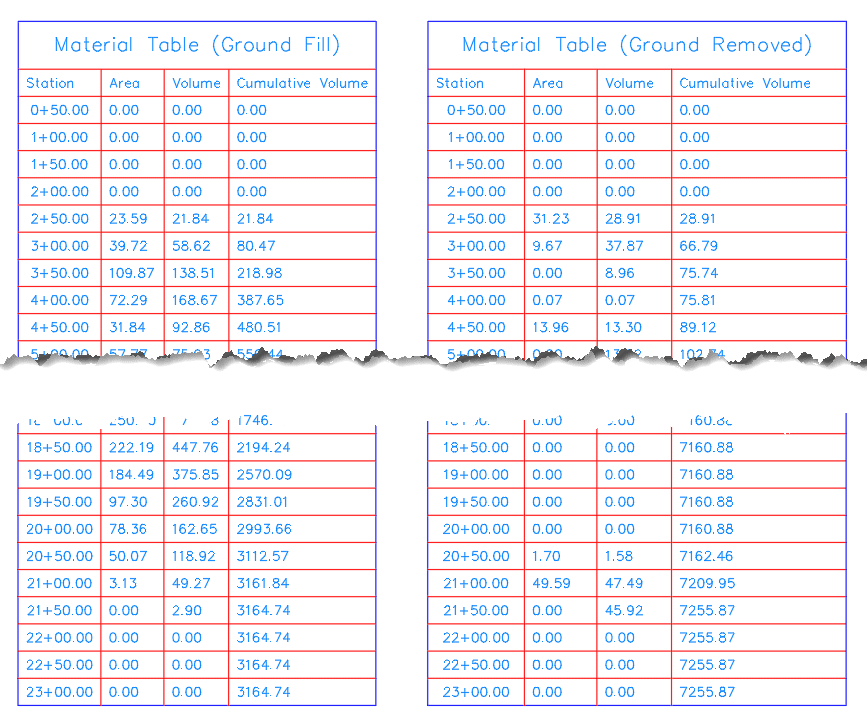
I hope you found these tips useful on the many ways to show off cut and fill values. If you would like to learn more, IMAGINiT can help your team navigate the almost endless settings and features in Civil 3D.
About the Author
More Content by Leo Lavayen


