
AutoCAD had two plot table options: Color dependent and Style based plotting. This post explores using different plot configurations to create different deliverables using the same base drawing.
Option 1: COLOR or Black & White
Using the same drawing file creating COLOR or Black & White output is as simple as selecting a plot style configuration that will dictate the plot. As shown below the out of the box Color-dependent(.ctb) files are used:
• acad.ctb - for full COLOR results
• monochrome.ctb – for a Black & White 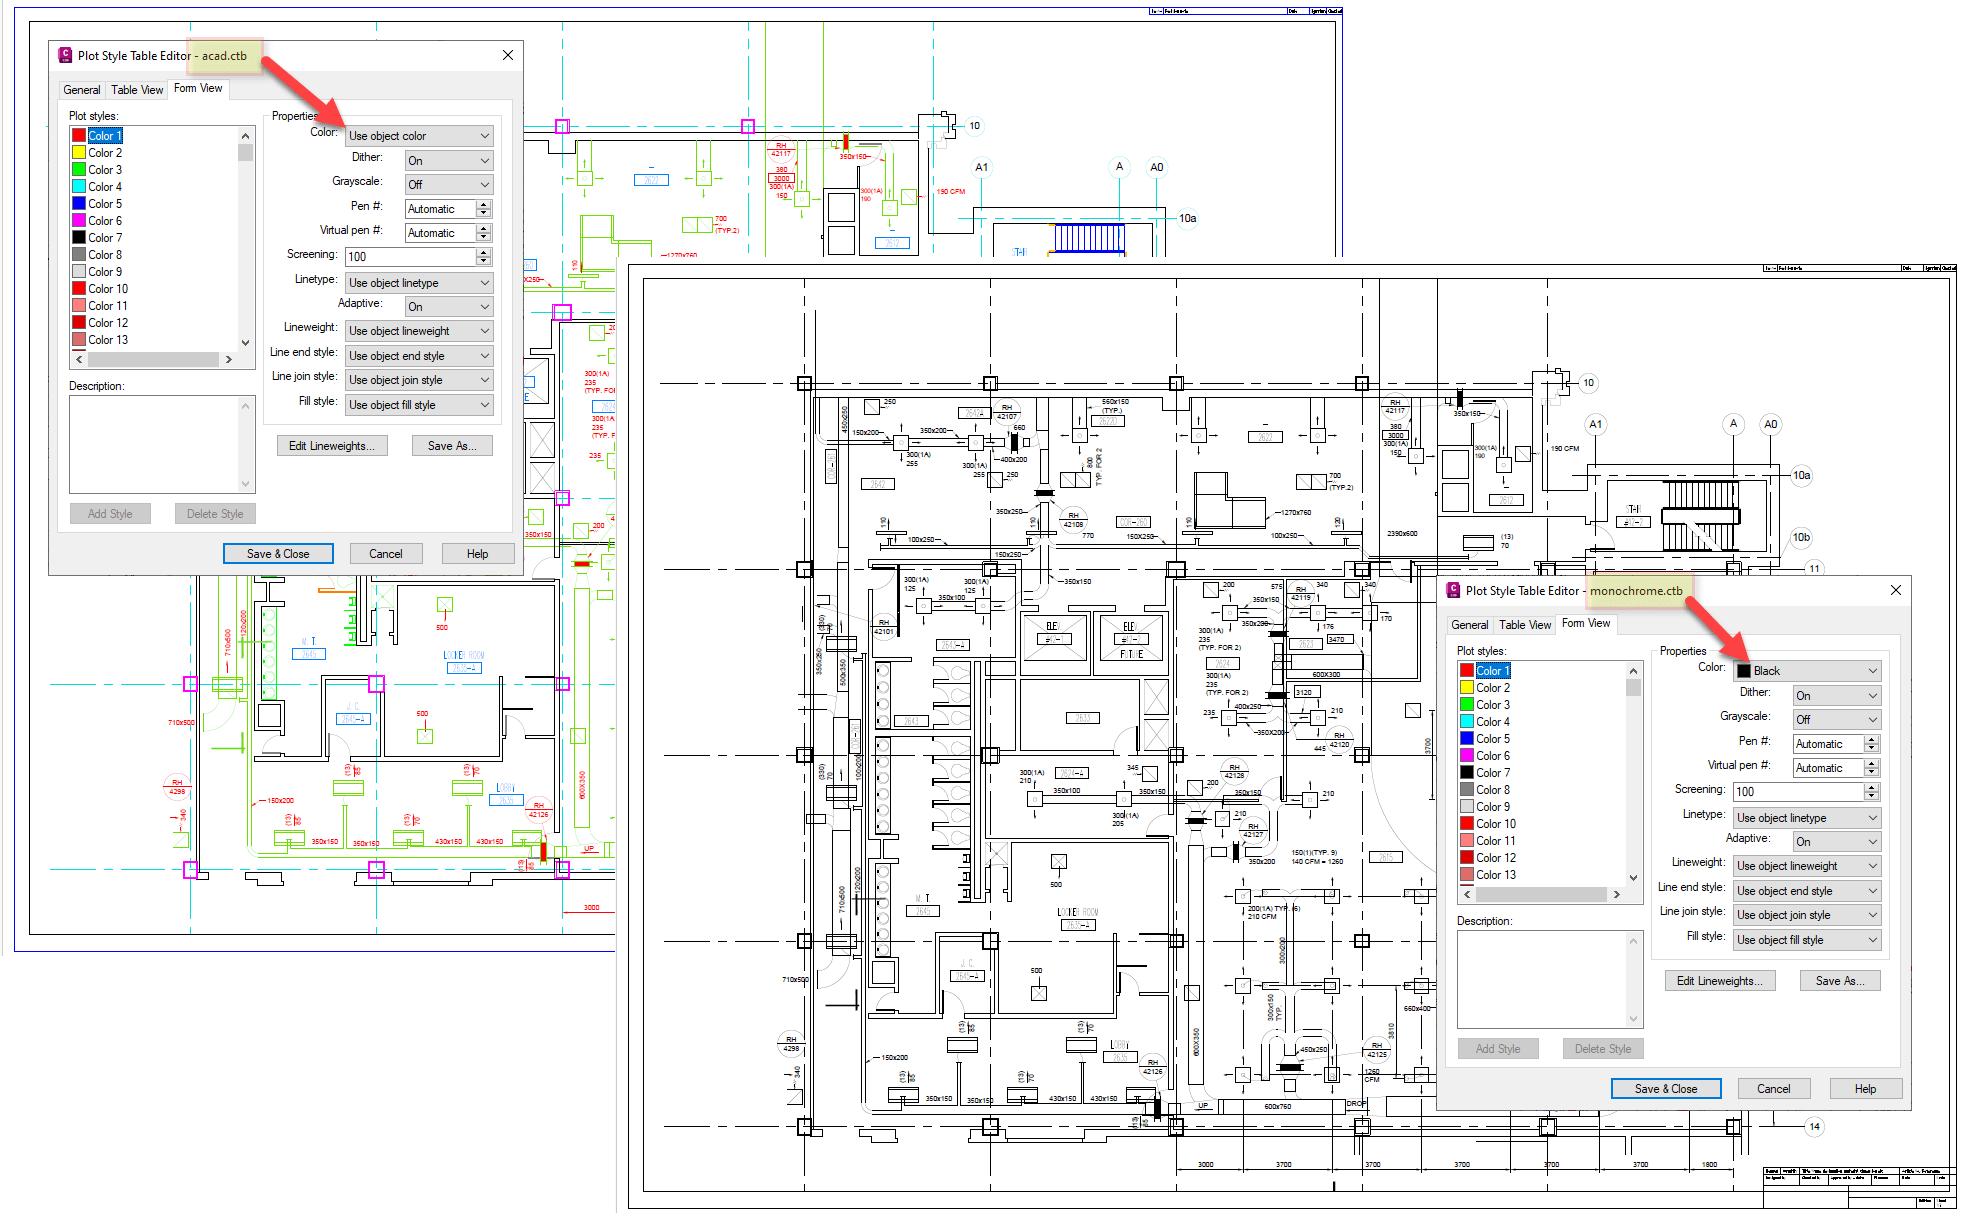
Option 2: highlighting design by switching Color (.ctb)
First Example here is the HVAC linework is highlighted. In the sample drawing the layer color is a value of 72 (green), then in the plot table (ARCH-HVAC.ctb) Color 72 is set to Use object color. All other layers are set to plot to black. 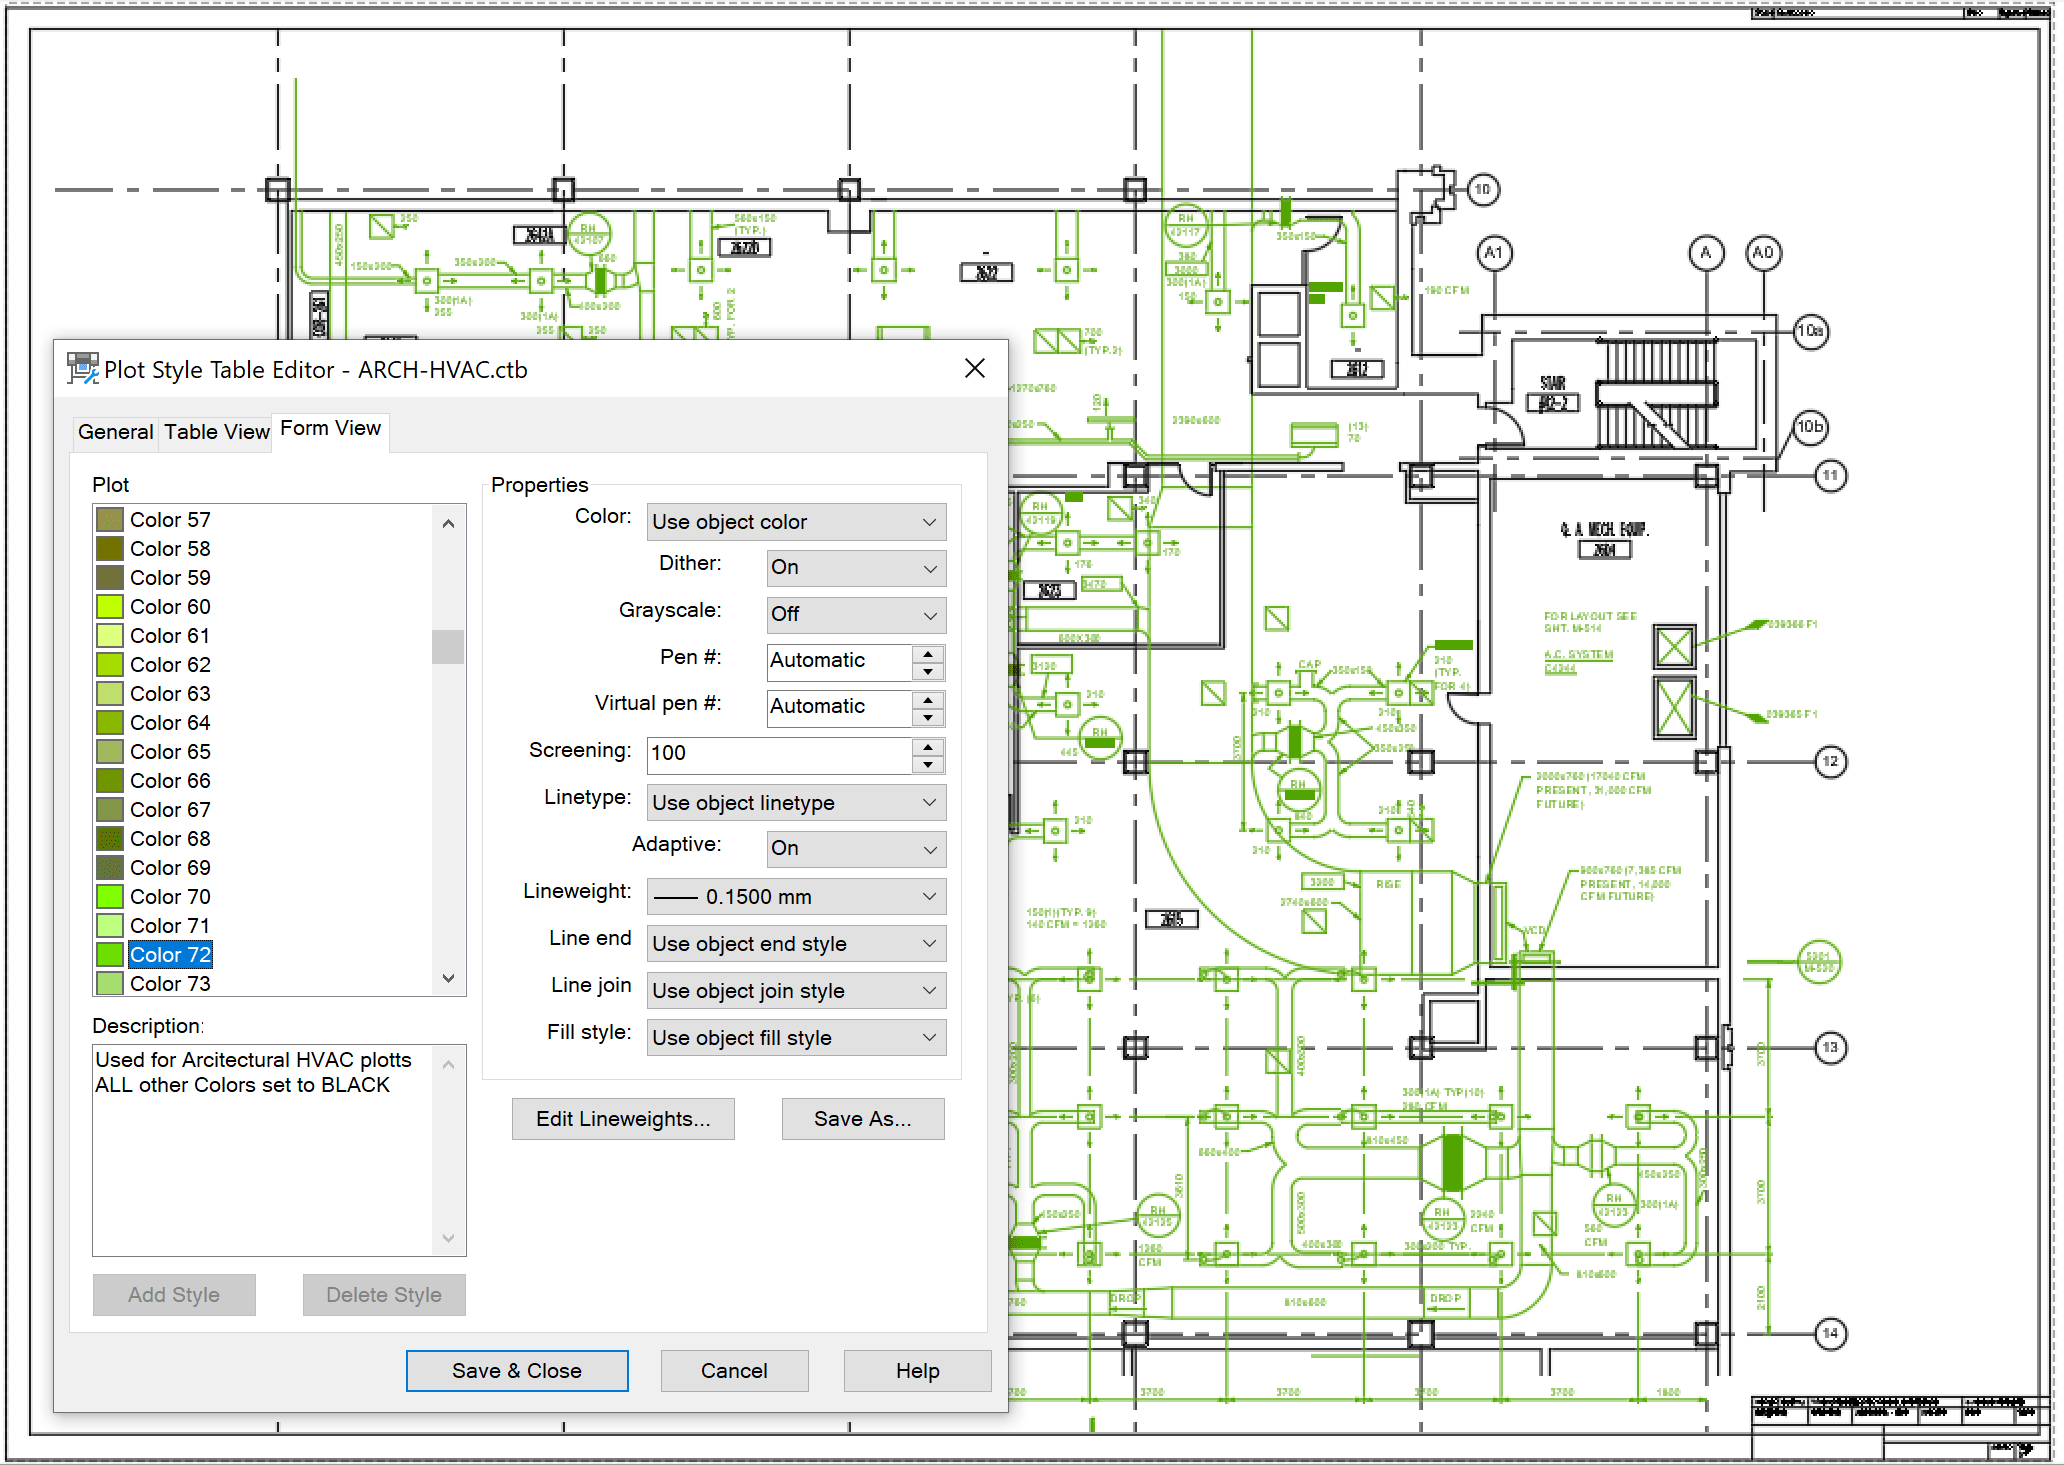
In the next example, using the same drawing, the STRCUTRAL components are highlighted. Here layers with color value 132 (blue) and 220 (pink) will stand out. A preconfigured plot table (ARCH-STRCT.ctb) have Color 132 and Color 220 are set to Use object color, the rest of the linework is set to use Black. 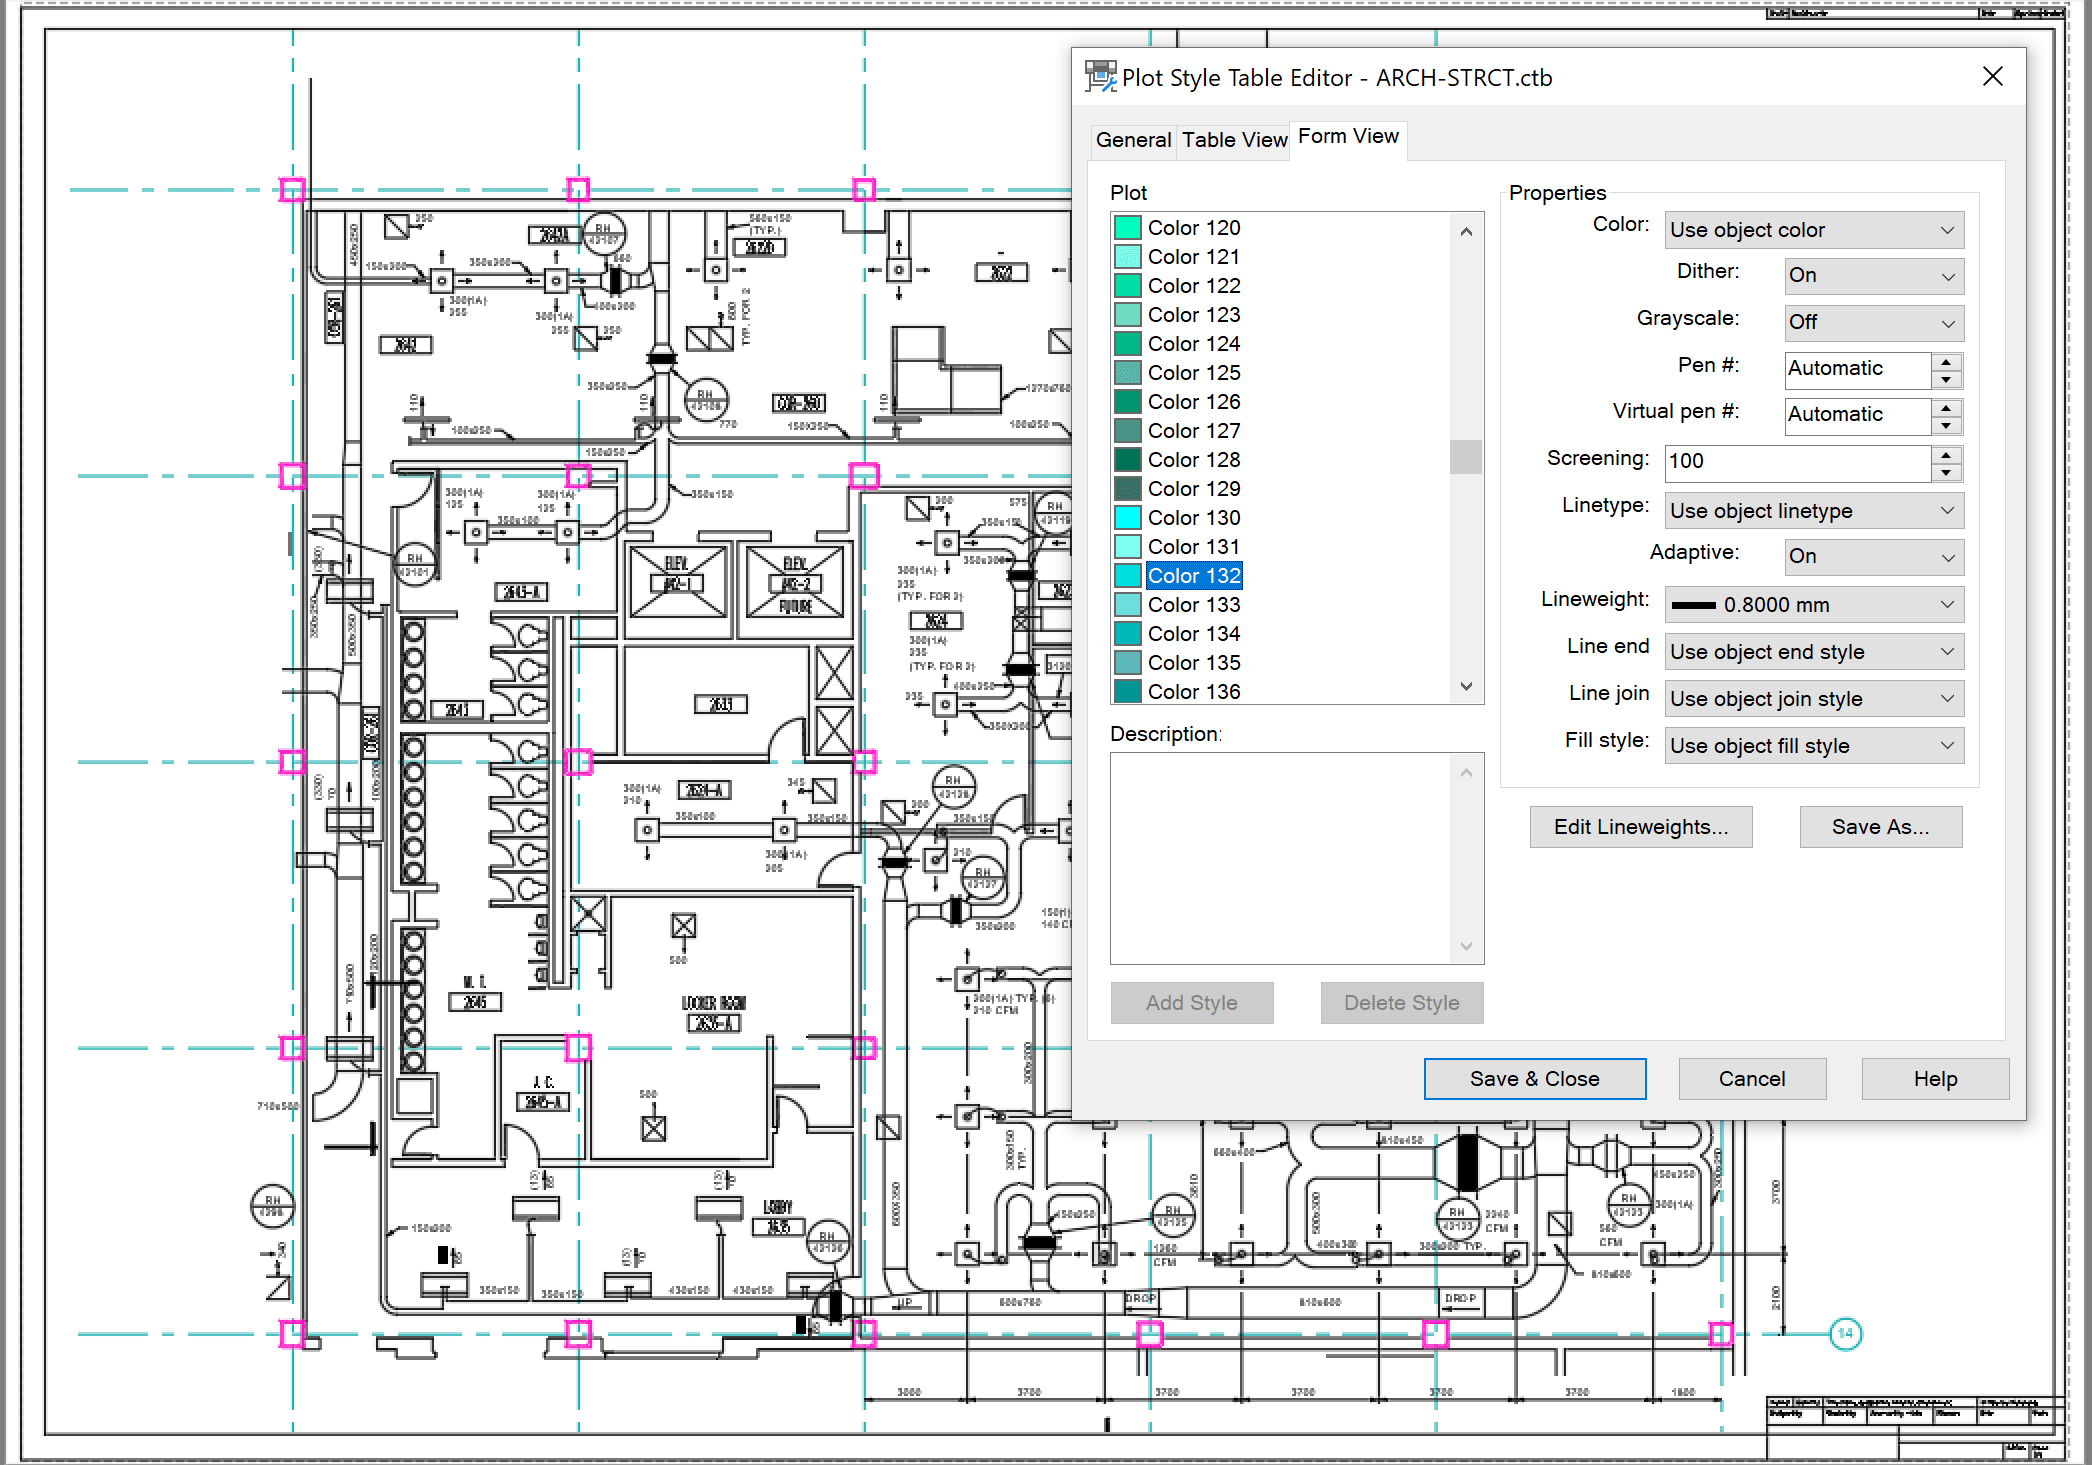
Option 3: highlighting design by applying layer overrides using styles (.stb)
Alternately, plotting using the common Color dependent (.ctb), the Style based (.stb) plot tables are also available. Below is a sample civil site, when printed the layers are set to plot Black or Screened. 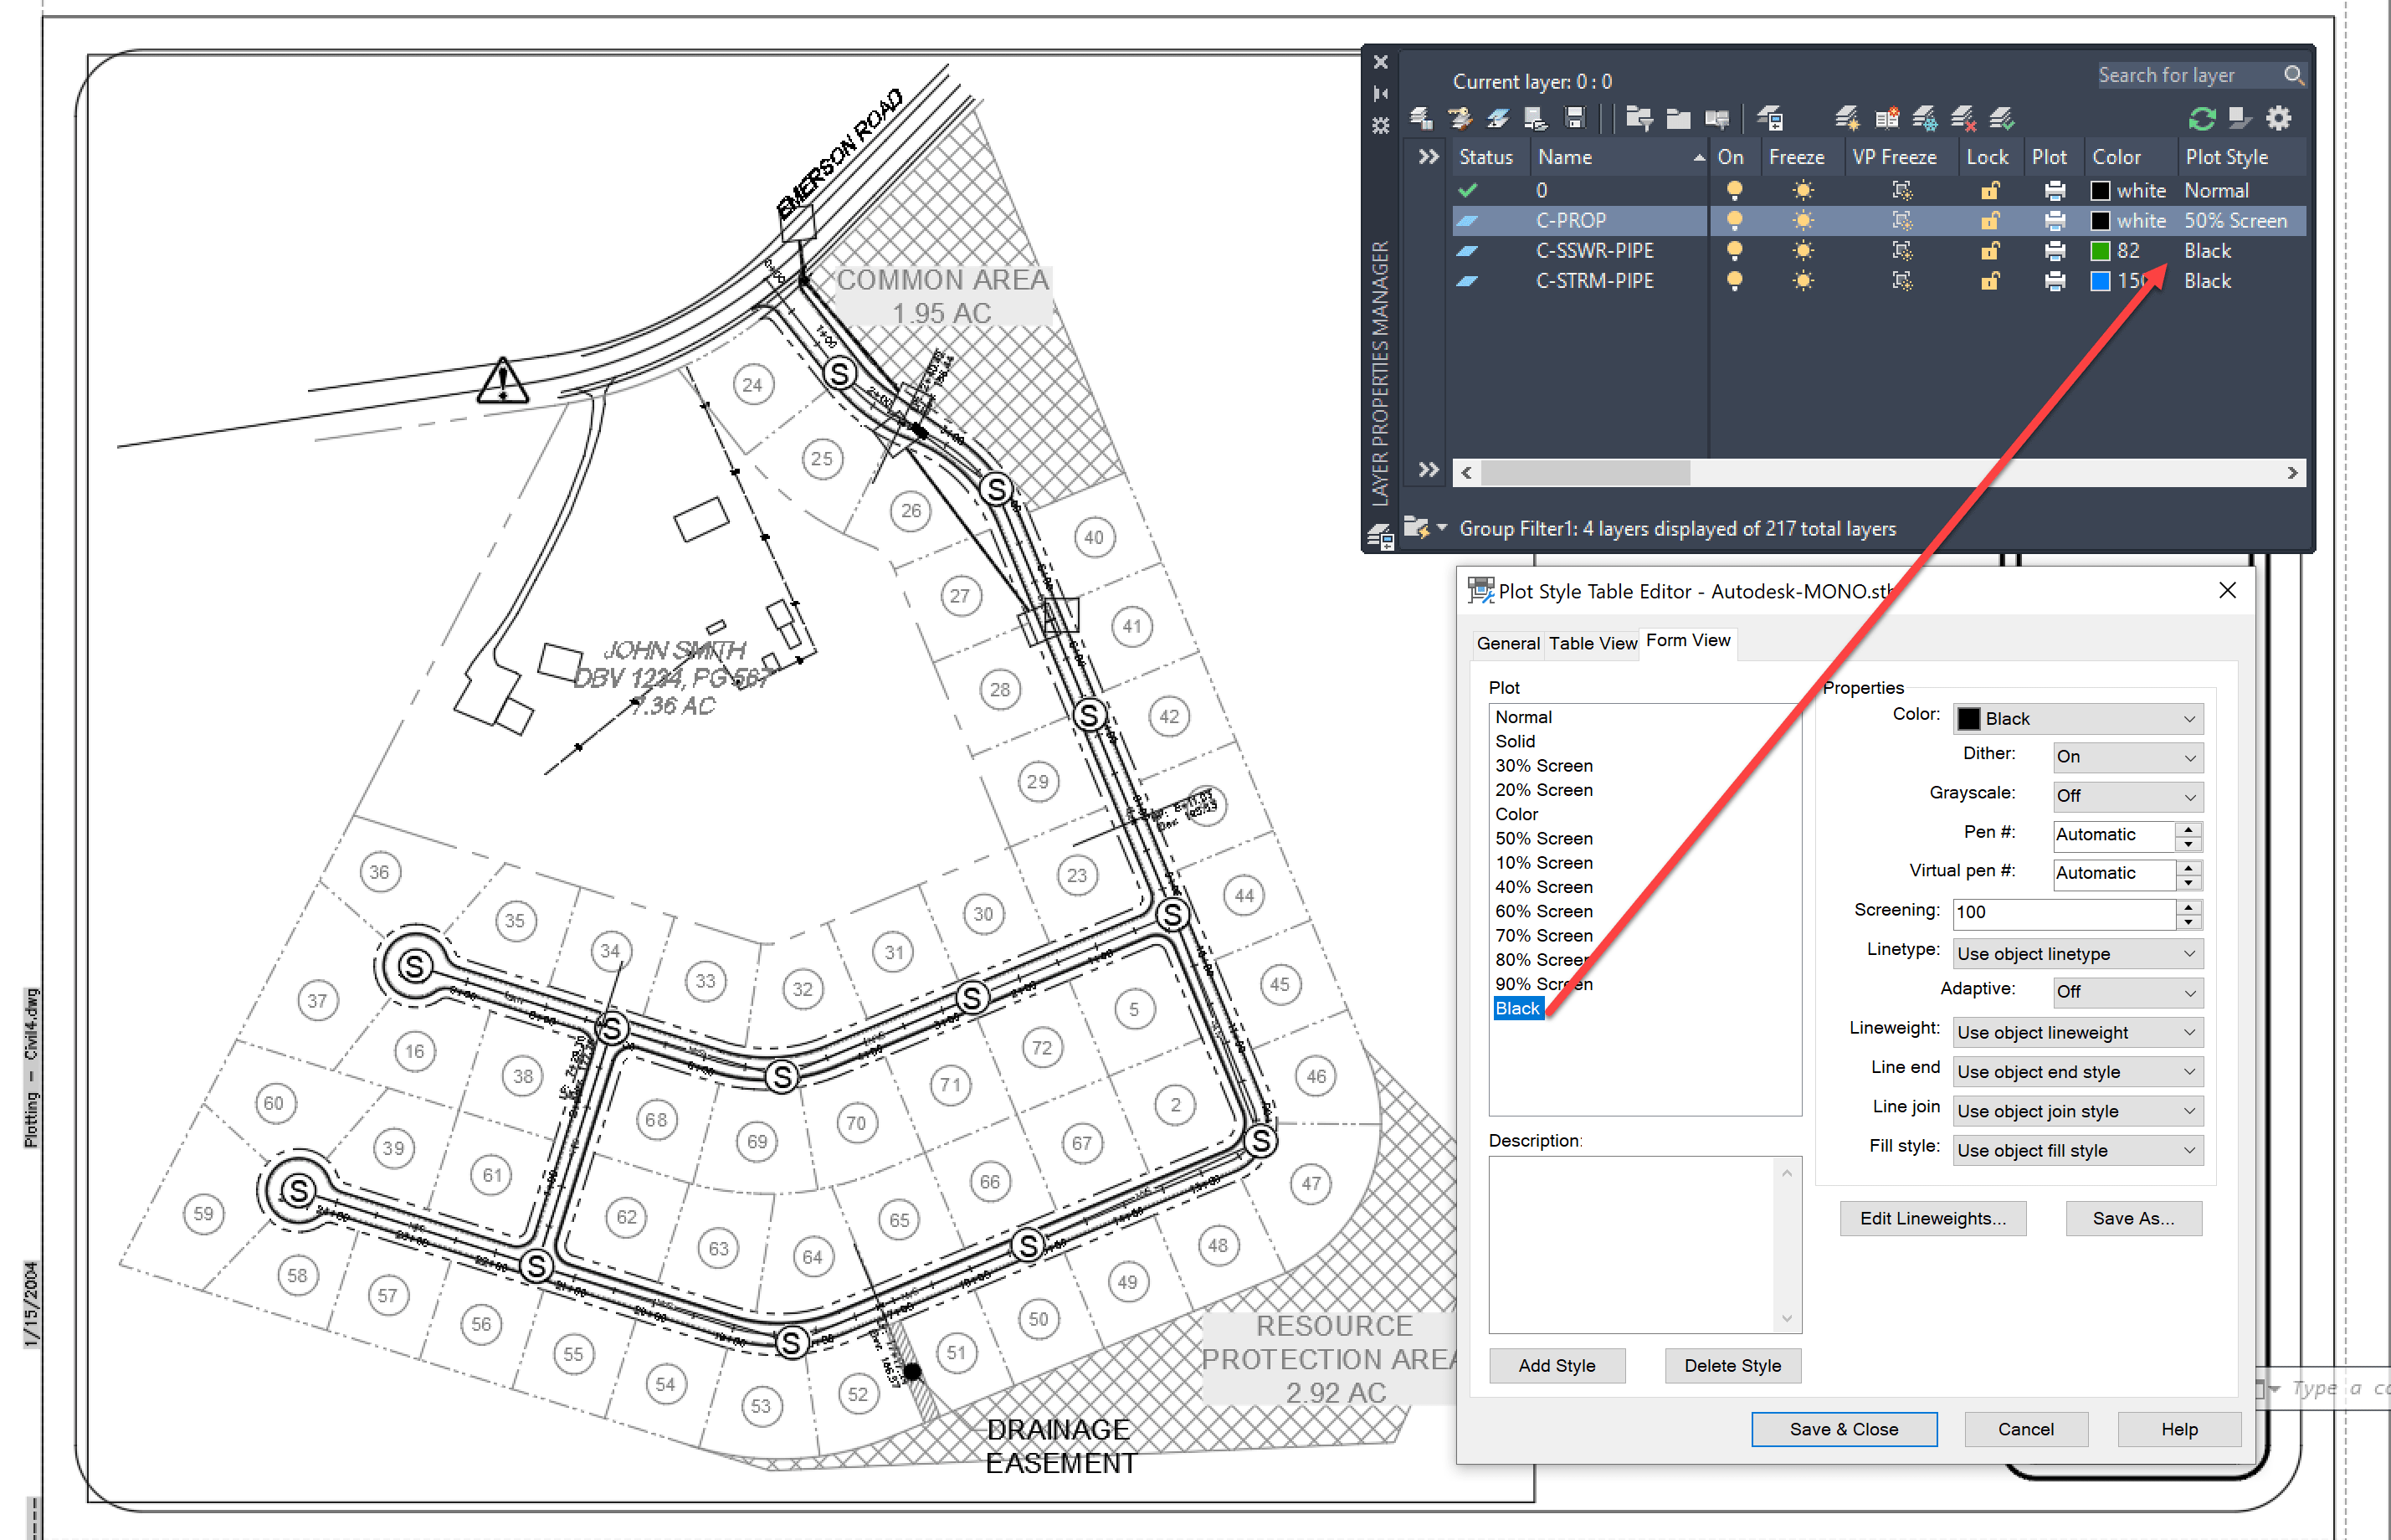
In AutoCAD, from paper space, individual layers properties can be overridden in a viewport. All layer properties can be altered as an override: on/off, frozen/thaw, color, linetype, lineweight, etc…
In the example below, two viewports are created in the same layout:
• Top viewport: Sewer layers (green) have been overridden to a “Color” plot style.
• Bottom viewport: Storm layers (blue) have been overridden to a “Color” plot style .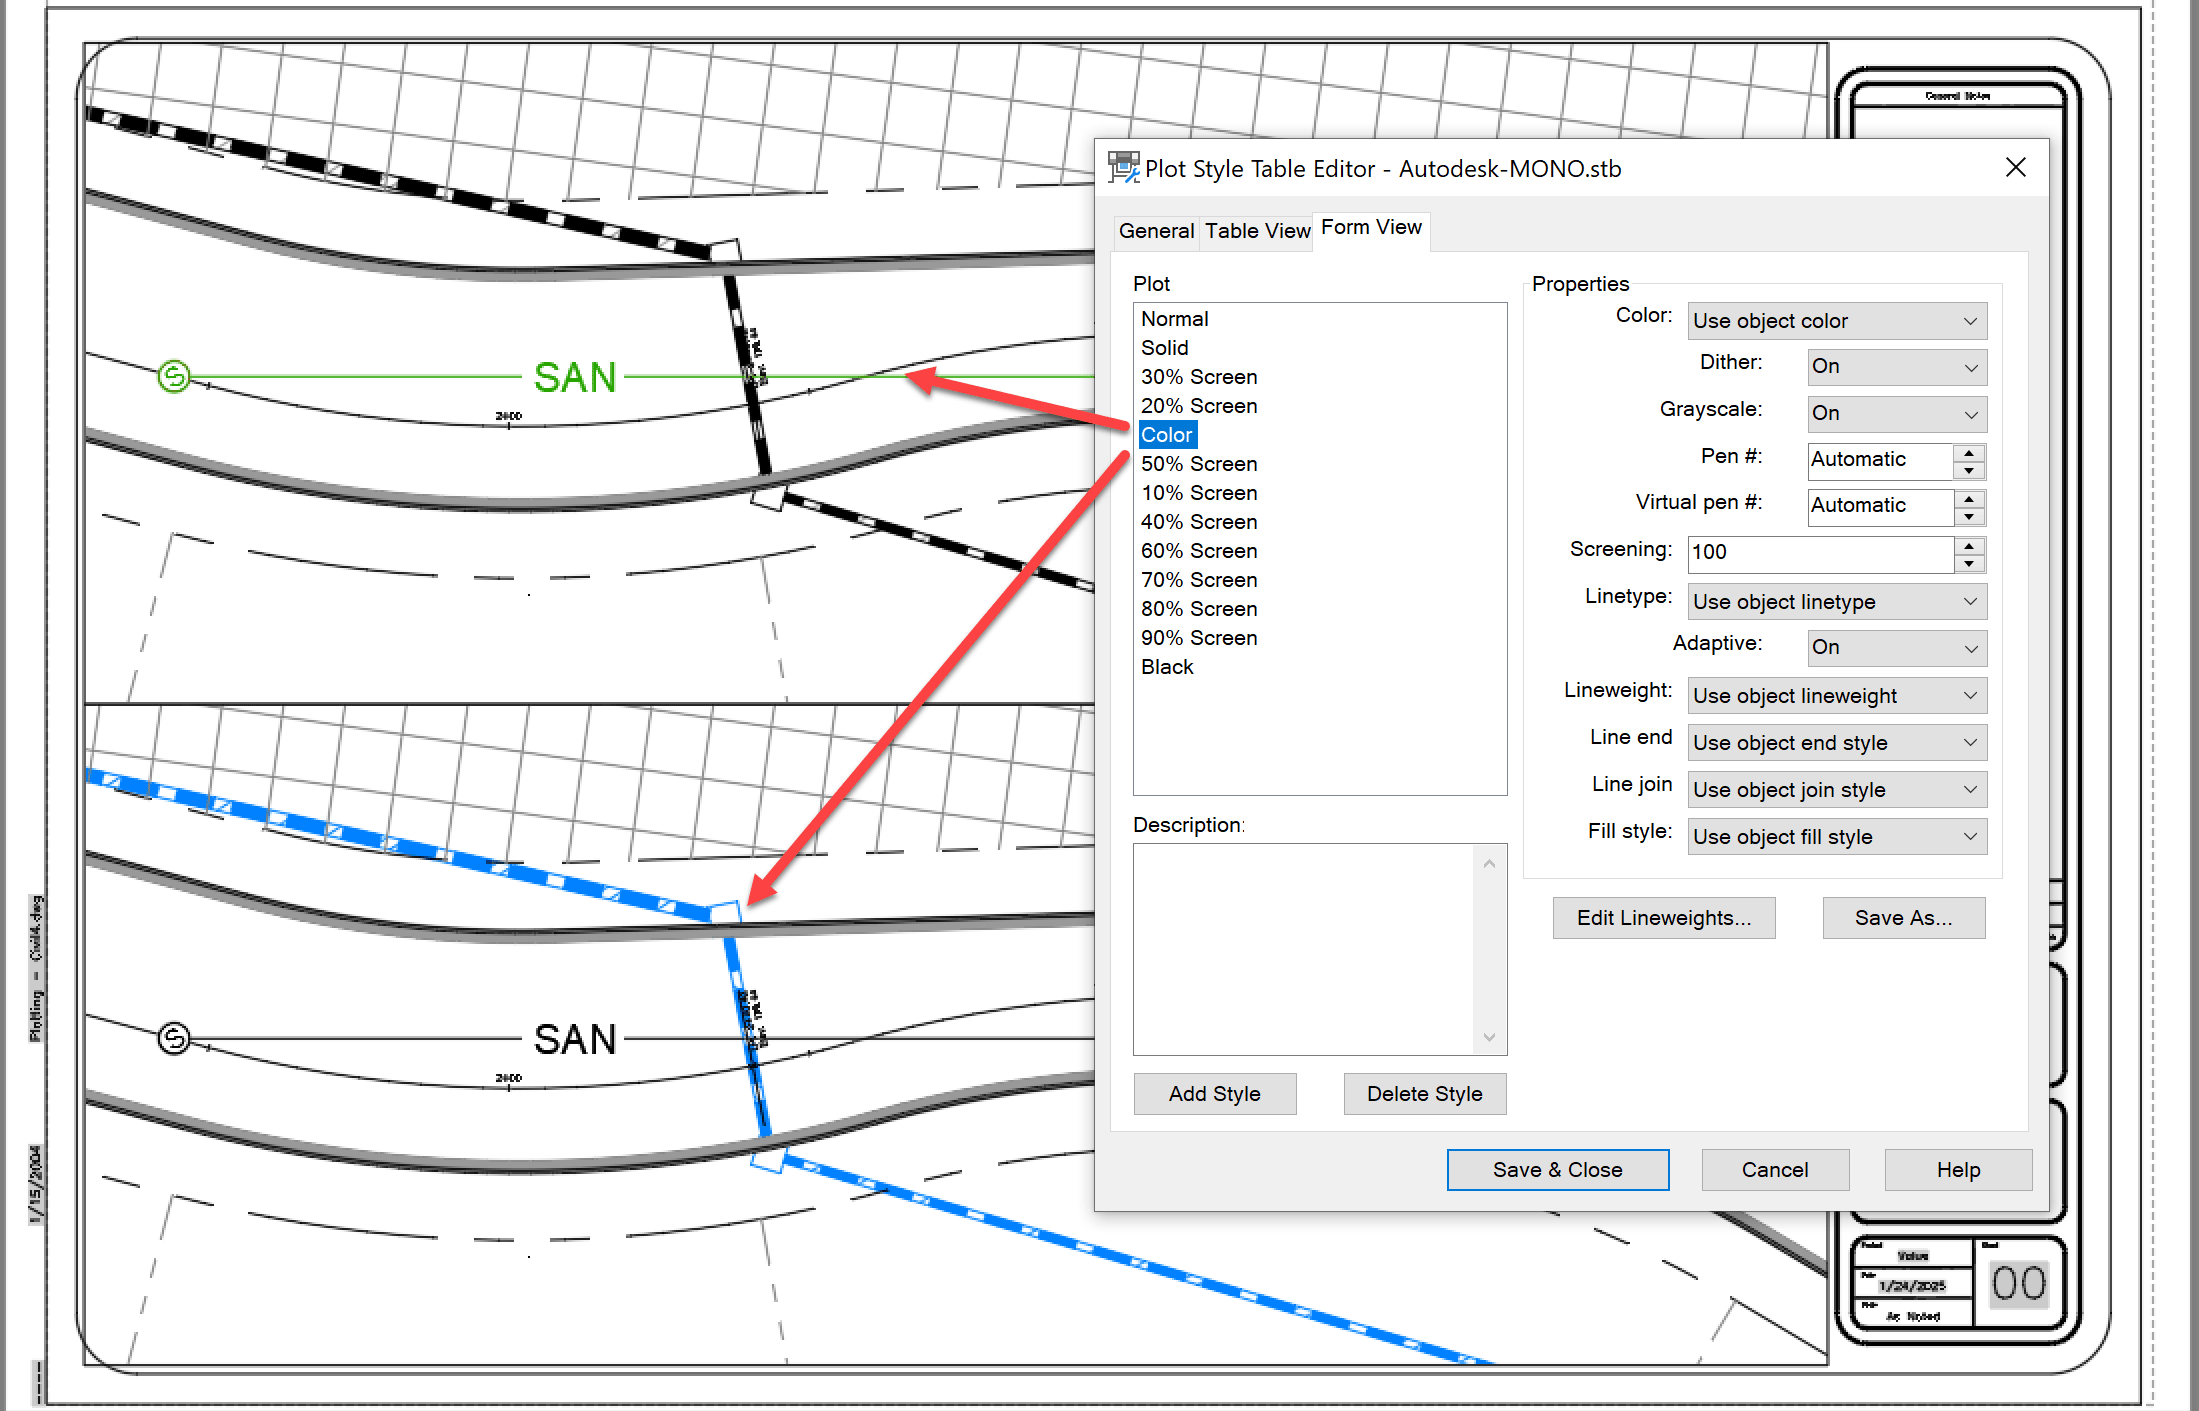
This viewport specific control can be used in both Color and Style based drawings. Both powerful and dangerous, be careful when this is used. Note how the columns with “VP” prefix are only shown when working in a viewport. 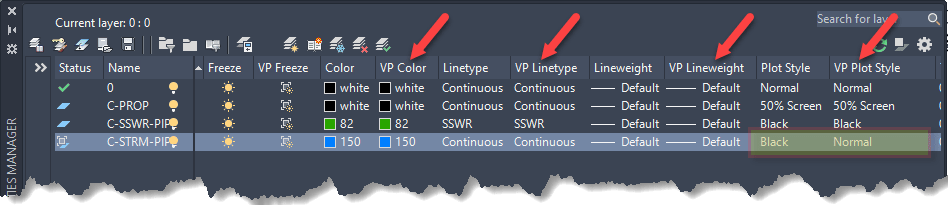
These are some of the plot functions that can be taken advantage of without drawing or layer alterations. If you enjoyed this post, please visit our main page for more post like this:
About the Author
More Content by Leo Lavayen


